

PassMark has recorded year-on-year performance of both desktop and laptop processor performance since 2004, typically recording an increase or plateau in CPUs. Worryingly, the company now reports that it has recorded a decline in performance for the first time in over 20 years.
According to PassMark graphs, early 2025 average CPU performance has regressed by 0.5% on desktops and 3.4% on laptops compared to 2024. For comparison, 2024 saw a 9.5% increase for desktops and 13.9% for laptops against 2023. This notably contrasts with 2018 to 2023’s noticeable uplifts which partly stem from increased competition between AMD and Intel.
With that in mind, this doesn’t mean that overall CPU performance is going backwards despite apparent stagnation in some areas with chips like Core Ultra 285K. These graphs are made from thousands of benchmark results based on PerformanceTest V5 to V11 and are updated every two weeks. Plus, data before 2021 does not include ARM and mobile devices. In other words, old results only include Windows machines powered by x86 processors from Intel and AMD.
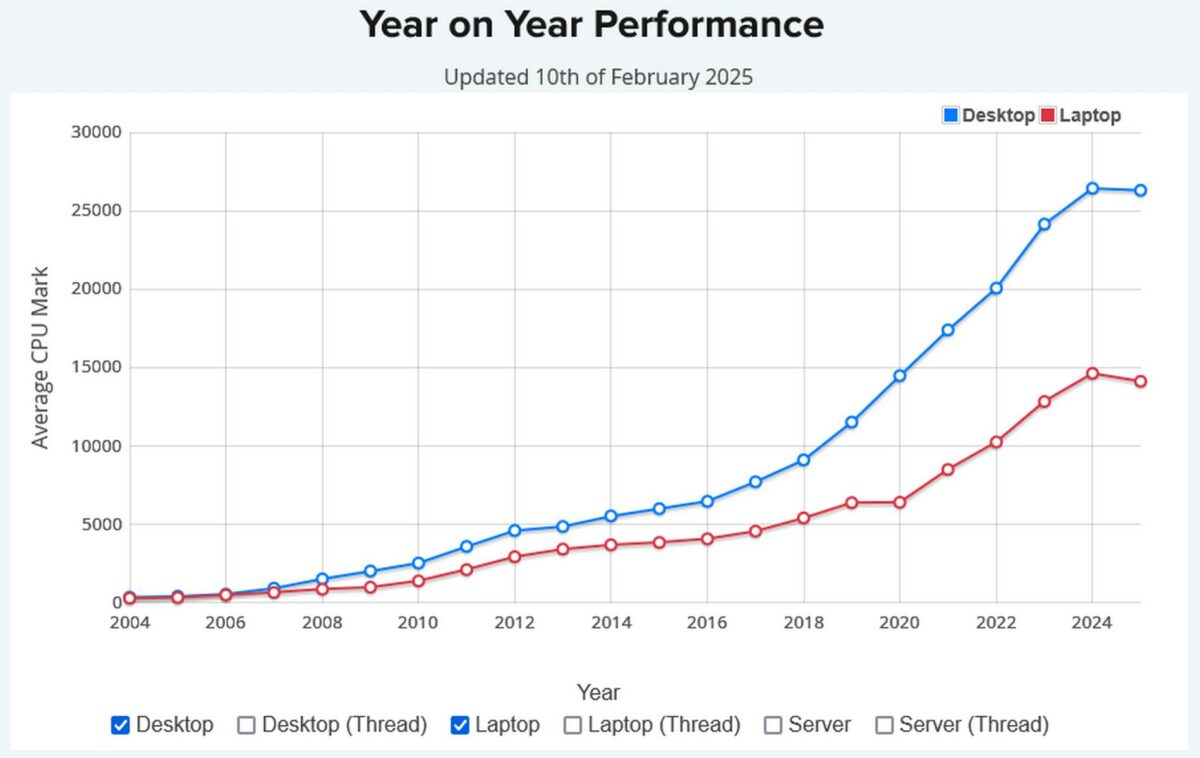
Since we are still at the beginning of 2025, these only represent 41 days worth of submitted benchmarks. To be exact, the 2025 desktop results are based on 47,810 samples, against 186,053 for the 2024 period. The same goes for laptops which count 25,541 samples in 2025, against 101,316 in 2024. While the graphs could continue going downhill as the year passes by, they could recover as more users upgrade their machines with the latest hardware.
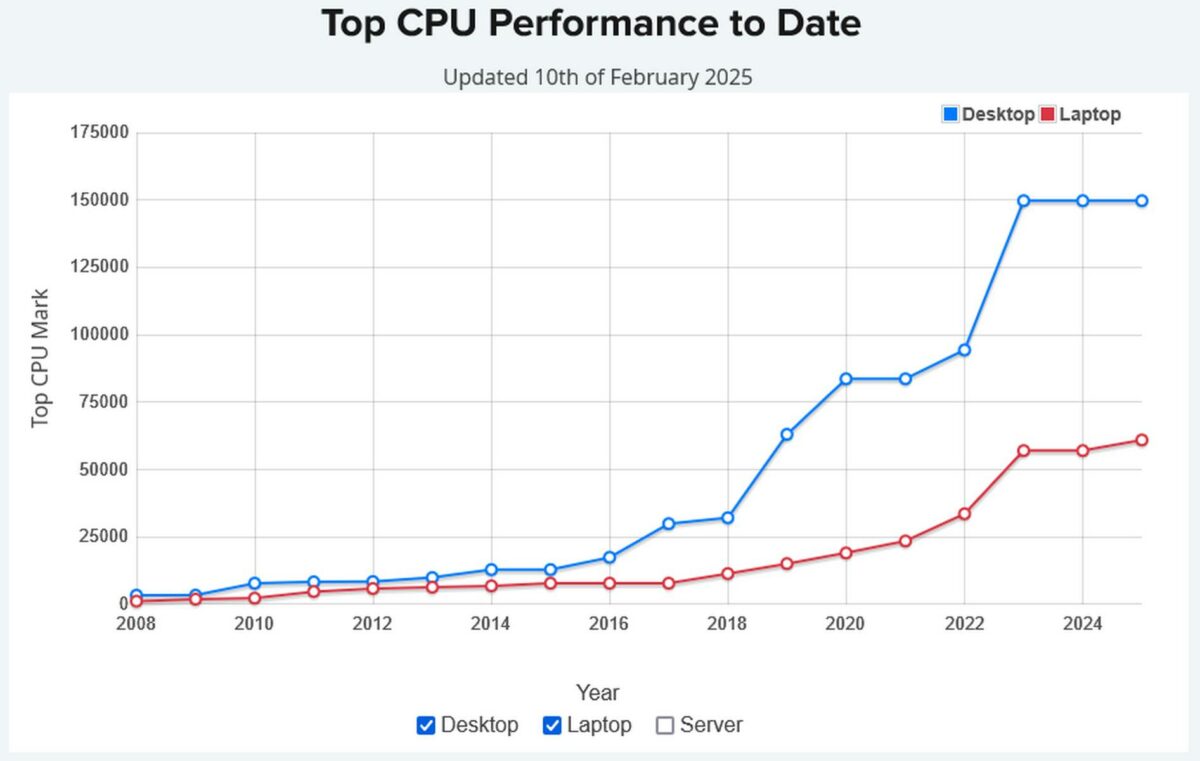
PassMark has also shared a graph regarding overall top performance where we see no change for the last three years in desktops where AMD’s Threadripper Pro 7995WX reigns supreme. Laptops however saw a small 6.8% boost thanks to chips like Intel’s Core Ultra 275HX, but things may change in the future.
While these results are intriguing, we should wait till 2026 to get a full picture of this year. Besides, these graphs only represent a trend and lack the nuance of showcasing generational growth and other improvements.