
The arrival of Nvidia GeForce RTX 5070 Ti coincides with the sunsetting of Radeon RX 7900 XT, as AMD makes way for imminent 9000 Series successors. There’s still plenty of value to extract from Team Red’s outgoing RDNA 3 graphics cards, though, and it may just surprise you how well this model holds its own against Nvidia’s new stock.
In lieu of Radeon RX 9070 XT, the baton falls to Radeon RX 7900 XT as the most appropriate rival to GeForce RTX 5070 Ti. Though AMD’s card began its life as an $899 graphics card, its price is now far more comparable to Nvidia’s new offering. Without further ado, let’s see how they stack up.
Specs
Nvidia’s new Blackwell architecture uses the same TSMC 4N process as the company’s previous Lovelace efforts, but this doesn’t equate to any meaningful familiarity in the bout between GeForce RTX 5070 Ti and Radeon RX 7900 XT. There’s just over two years of hardware innovations separating the two graphics cards amidst some crumbs of common ground.
| RTX 5070 Ti | RX 7900 XT | Ratio | |
|---|---|---|---|
| Released | Feb 2025 | Dec 2022 | – |
| Codename | Blackwell | Plum Bonito | – |
| GPU | GB203 | Navi 31 XT | – |
| Process | TSMC 4N (4nm) | TSMC 5/6 | |
| Transistors | 45.6bn | 57.7bn | 0.79 |
| Die size | 378mm² | 529mm² | 0.71 |
| Cores | 8,960 | 5,376 | 1.67 |
| Base clock | 2,300MHz | 1,387MHz | 1.66 |
| Boost clock | 2,452MHz | 2,394MHz | 1.02 |
| FP32 Boost TFLOPS | 43.9 | 51.5 | 0.85 |
| SM count | 70 of 84 | 84 of 96 | 0.83 |
| RT cores | 70 (4th Gen) | 84 (2nd Gen) | 0.83 |
| RT TFLOPS | 133.2 | – | – |
| AI cores | 280 (5th Gen) | 168 (1st Gen) | 1.67 |
| FP16 Acc TFLOPS | 351.5 | 103.0 | 3.41 |
| ROPS | 96 | 192 | 0.50 |
| Memory | 16GB | 20GB | 0.8 |
| Memory type | GDDR7 | GDDR6 | – |
| Mem. clock | 28Gb/s | 20Gb/s | 1.4 |
| Mem. interface | 256-bits | 320-bits | 0.8 |
| Mem. bandwidth | 896GB/s | 800GB/s | 1.12 |
| Board power | 300W | 315W | 0.95 |
| Launch MSRP | $749 | $899 | 0.83 |
Both GeForce RTX 5070 Ti and Radeon RX 7900 XT feature cutdown versions of their respective GPUs, namely GB203 and Navi 31. Nvidia’s die is monolithic in design, slipping TSMC’s 4N process into a relatively petite package of 378mm² and packing 45.6bn transistors. Meanwhile, AMD adopts a chiplet-based approach using a combination of 5nm and 6nm nodes, crafting a larger 529mm² die with a higher transistor count of 57.7bn.
AMD fits more ray tracing accelerators into Radeon RX 7900 XT. However, quality can trump quantity and Team Green has experience on its side in this regard, rocking fourth generation versions in place of Team Red’s second gen designs. This similarly applies to AI accelerators but both have ample amounts.
Radeon RX 7900 XT similarly takes a more-is-merrier approach with its memory buffer, packing an ample 20GB GDDR6 under the hood across a wider 320-bit bus. GeForce RTX 5070 Ti’s 16GB and 256-bit interface pales by comparison, but it gains ground with GDDR7 modules running at 28Gb/s, giving it a larger total bandwidth of 896GB/s to AMD’s 800GB/s.
A handful of watts separate the TDPs, with Radeon RX 7900 XT pulling 315W and GeForce RTX 5070 Ti getting by on just 300W. It is worth nothing, though, that AMD’s card doesn’t feature 12V-2×6 power connectors like Nvidia, instead opting for old reliable 8-pin headers.
Finally, GeForce RTX 5070 Ti models are available starting from $749, a lower price than Radeon RX 7900 XT’s launch price tag of $899. However, you can find admittedly dwindling stock of Team Red’s card for closer to $650 among retailers, and plenty more on the used market. This could spell trouble for the former pixel pusher’s value, particularly if initial stock proves slim.
Performance
To compare GeForce RTX 5070 Ti and Radeon RX 7900 XT on equal grounds, both cards have recently spent time in the Club386 7950X3D test bench. These are totally fresh tests using the latest drivers available from each manufacturer and using Windows 11 24H2.
Our 7950X3D Test PCs
Club386 carefully chooses each component in a test bench to best suit the review at hand. When you view our benchmarks, you’re not just getting an opinion, but the results of rigorous testing carried out using hardware we trust.
Shop Club386 test platform components:
CPU: AMD Ryzen 9 7950X3D
Motherboard: MSI MEG X670E ACE
Cooler: Arctic Liquid Freezer III 420 A-RGB
Memory: 64GB Kingston Fury Beast DDR5
Storage: 2TB WD_Black SN850X NVMe SSD
PSU: be quiet! Dark Power Pro 13 1,300W
Chassis: Fractal Design Torrent Grey
Both graphics cards have memory configurations up to the task of rendering games at 2160p (UHD). As such frame rates for that lofty resolution as well as 1440p (QHD) and 1080p (FHD) feature below.
Application and AI
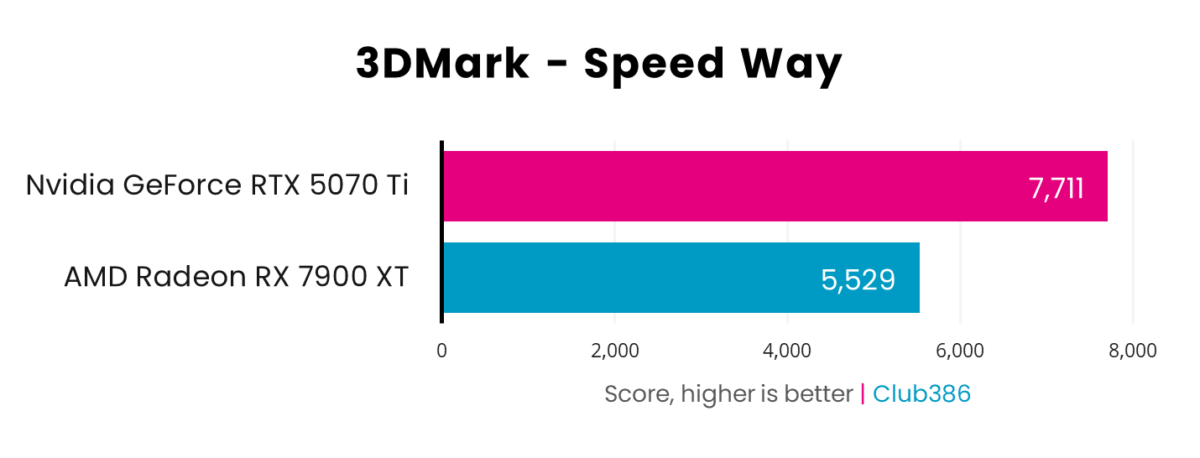
3DMark Speed Way sees GeForce RTX 5070 Ti pull significantly ahead of Radeon RX 7900 XT to the tune of 28%. Nvidia’s fourth generation ray tracing cores are miles ahead of AMD’s sophomore efforts, compounding an already well-understood lead that the company established prior to the launch of Blackwell GPUs.
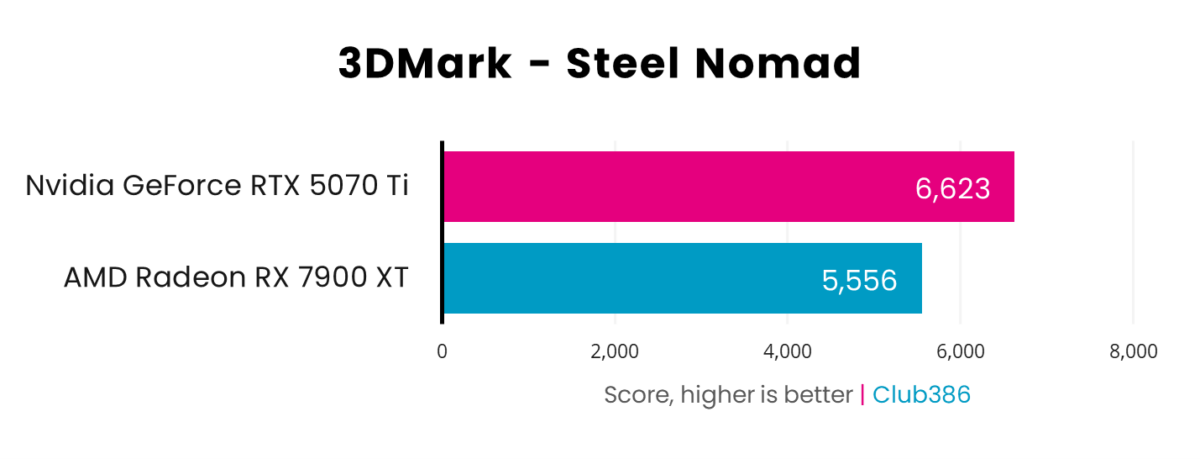
GeForce RTX 5070 Ti claims another victory in 3DMark Steel Nomad but the gap between it and Radeon RX 7900 XT is much smaller at 16%. Nvidia’s made it clear that improving raw rasterization is less of a priority for the company, placing greater focus on better ray tracing and AI-based performance enhancing features. It’s a forward-thinking philosophy given the slow shift away from this type of rendering but one that results in precarious leads that look ripe for AMD to exploit in the present with its incoming contenders.
As ever, remember that these are synthetic tests and aren’t always reflective of real-world performance. Treat them instead as general estimations of how GeForce RTX 5070 Ti and Radeon RX 7900 XT stack up against one another in games.
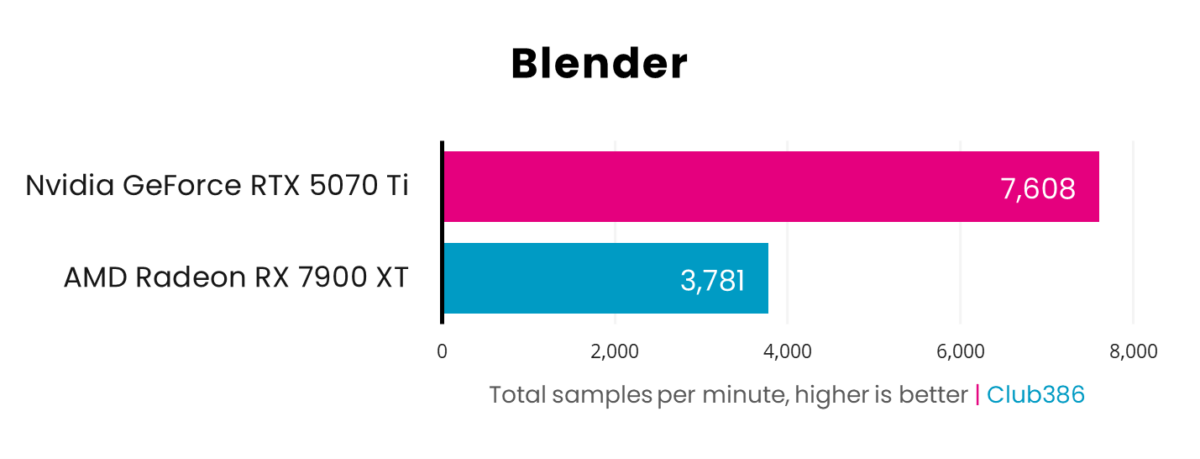
Blender performance is a sore spot for AMD, as Radeon RX 7900 XT’s 3,781 samples per minute makes plain standing next to the 7,608 of GeForce RTX 5070 Ti. The maturity of support for CUDA and OptiX GPU rendering over HIP certainly plays into this and there’s no telling when it will catch up now that Nvidia has more than double the performance.
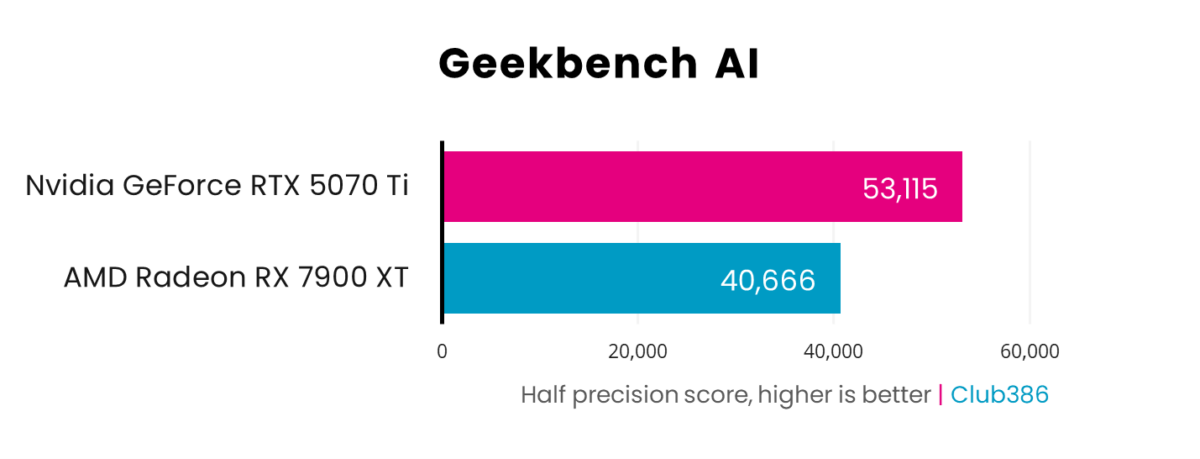
Nvidia’s AI chops come to the fore through Geekbench AI as GeForce RTX 5070 Ti musters a half precision score of 53,115, 30% ahead of Radeon RX 7900 XT waning but still respectable score of 40,666. AMD still has some catching up to do in terms of FP16 performance, once again showing its relative inexperience in the space through its first generation AI accelerators compared to its competitor’s fifth.
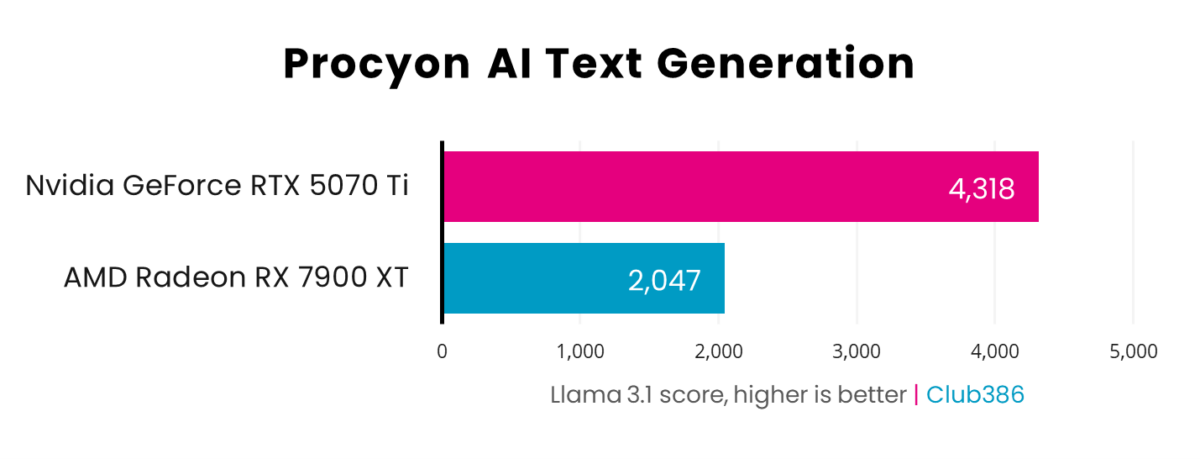
Comparing Llama 3.1 LLM performance on GeForce RTX 5070 Ti and Radeon RX 7900 XT is night and day. Nvidia runs rings around AMD here, more than doubling its AI text generation score. Once again, time and other forces are on Team Green’s side and show no signs of defecting.
Gaming
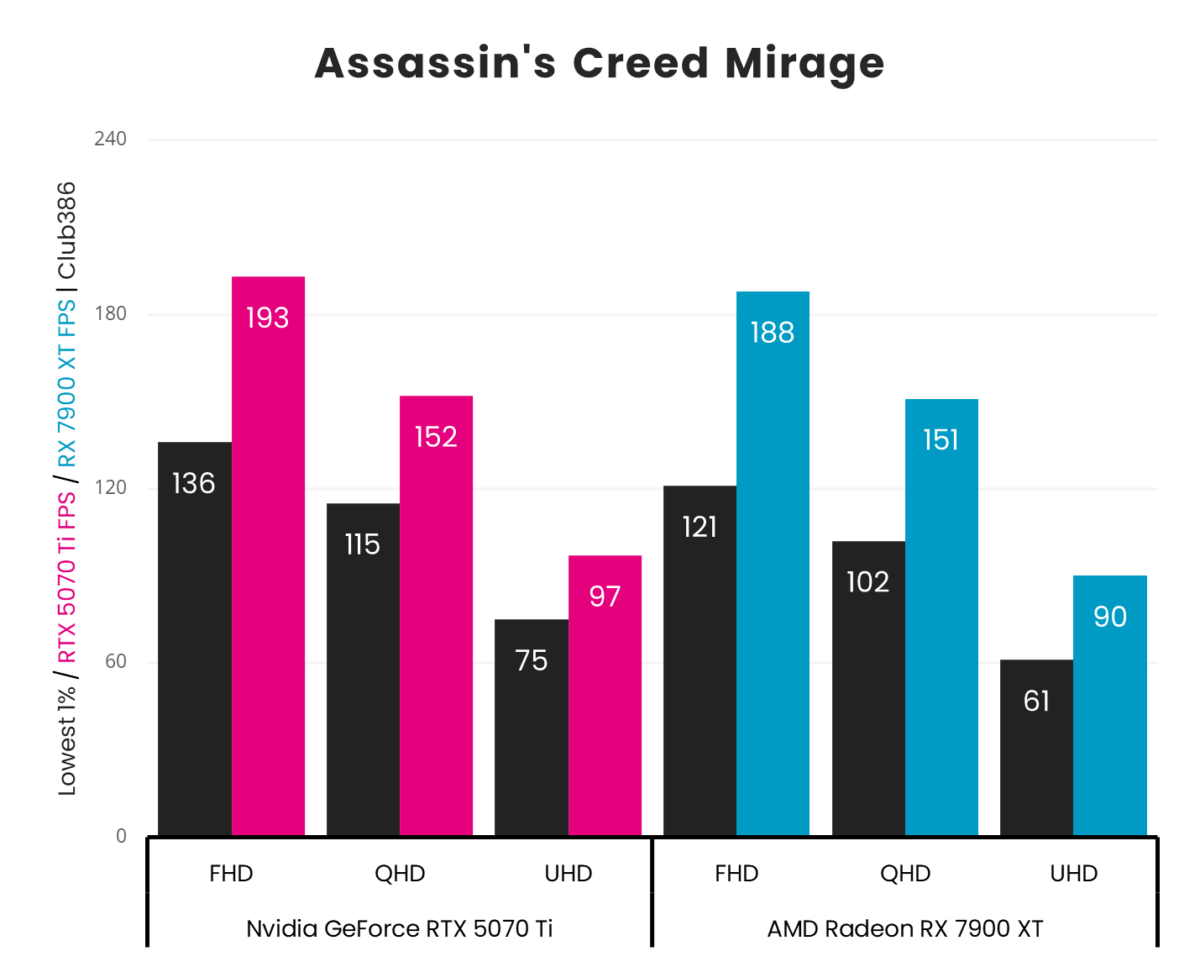
Given the beating Radeon RX 7900 XT received in the majority of synthetic benchmarks, it holds up surprisingly well in Assassin’s Creed Mirage much to the detriment of its rival. GeForce RTX 5070 Ti’s lead of a mere 7fps in average frame rates at most is far from compelling, particularly given this comparison is against the competition’s soon-to-be last generation offering.
However, its in 1% lows that AMD properly shows up Nvidia. Examining this metric more closely reveals leads of up to 35fps which goes a long way to providing more consistent levels of performance.
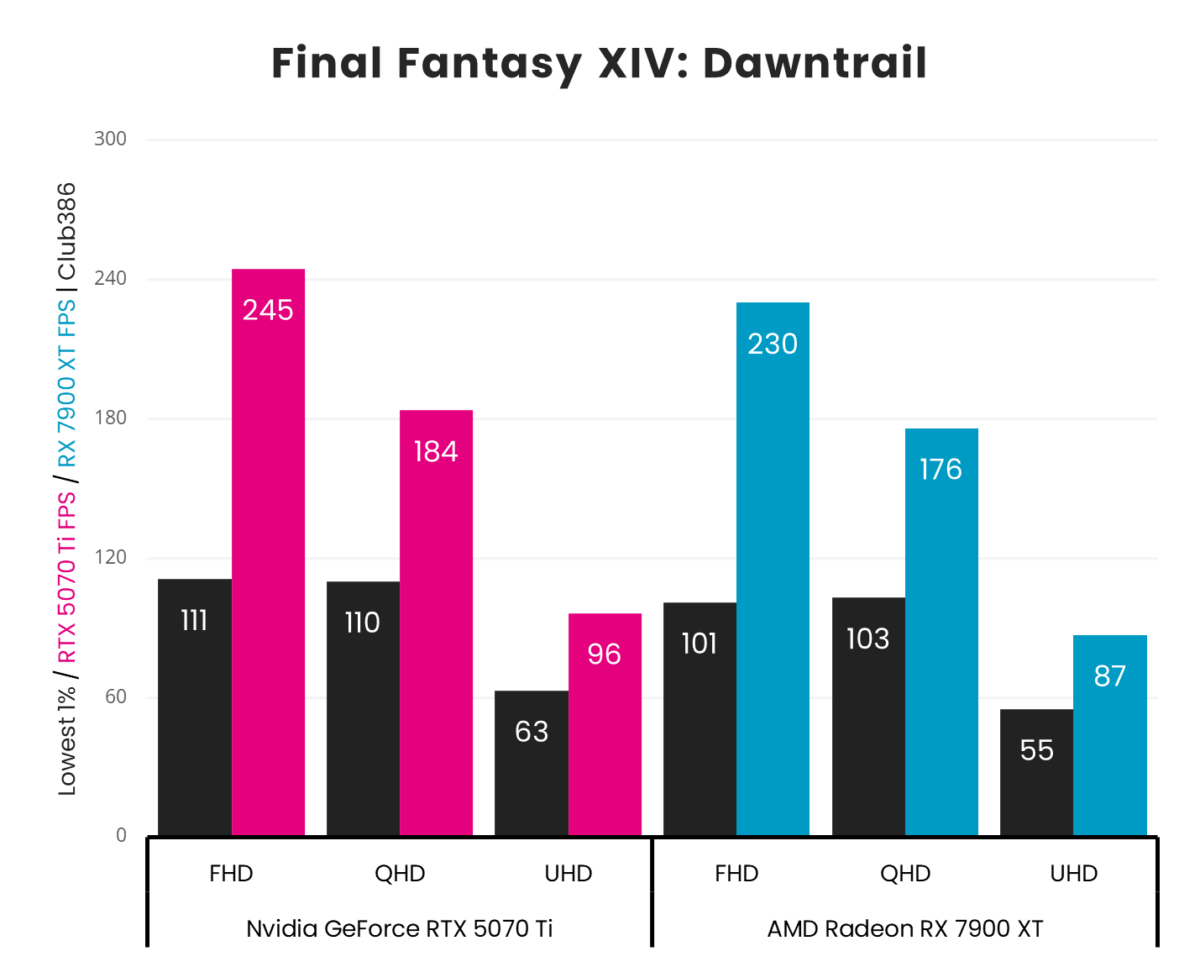
Continuing with rasterisation in Final Fantasy XIV: Dawntrail makes for improved but still underwhelming reading. GeForce RTX 5070 Ti enjoys leads of 9-15fps over Radeon RX 7900 XT in average frame rates and thankfully doesn’t drop the ball with its 1% lows either.
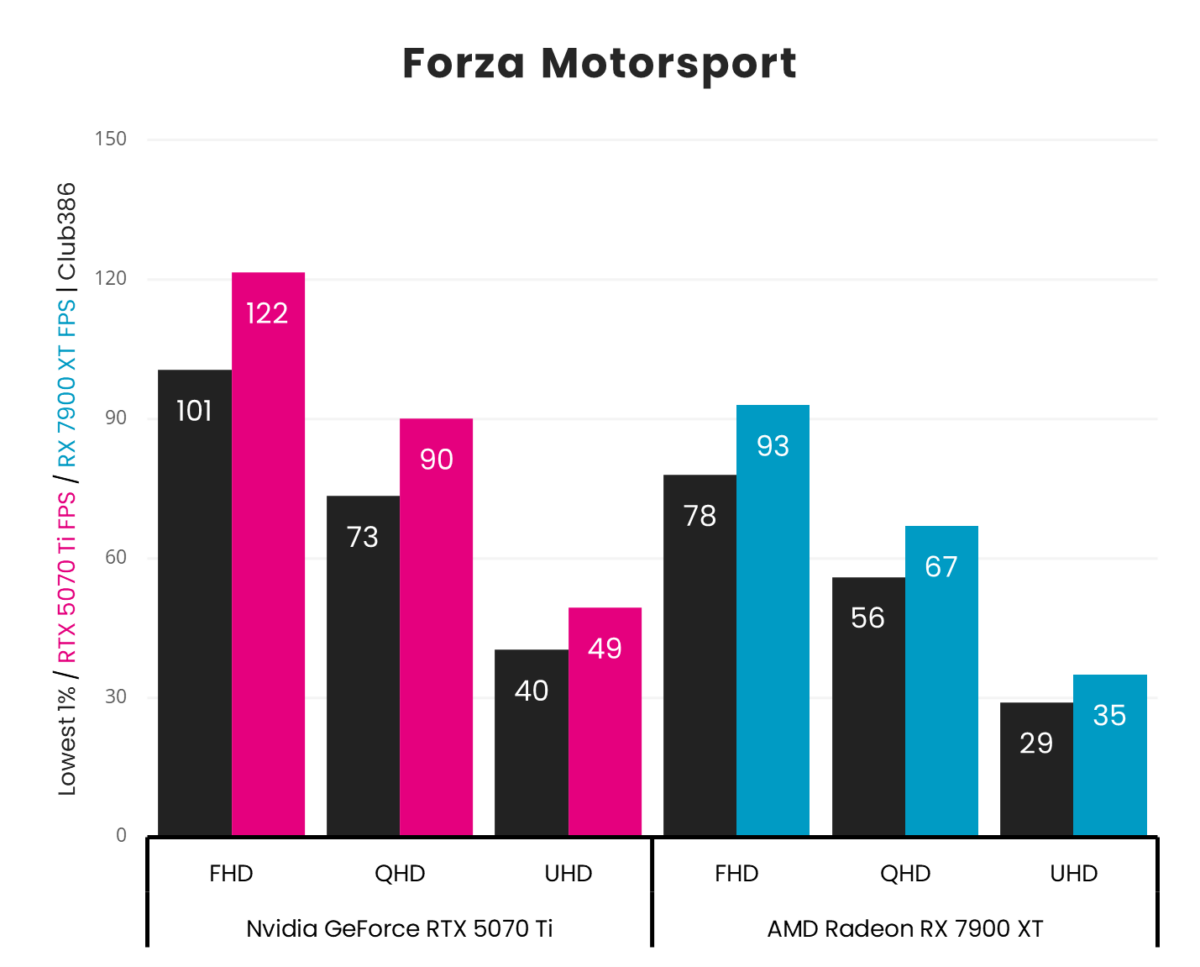
Each card handles Forza Motorsport’s ray traced effects well at FHD and QHD but neither has the rendering chops to achieve 60fps at native UHD. Nonetheless, GeForce RTX 5070 Ti earns a comfortable win in the racing game, outperforming Radeon RX 7090 XT by 24-29% depending on rendering resolution.
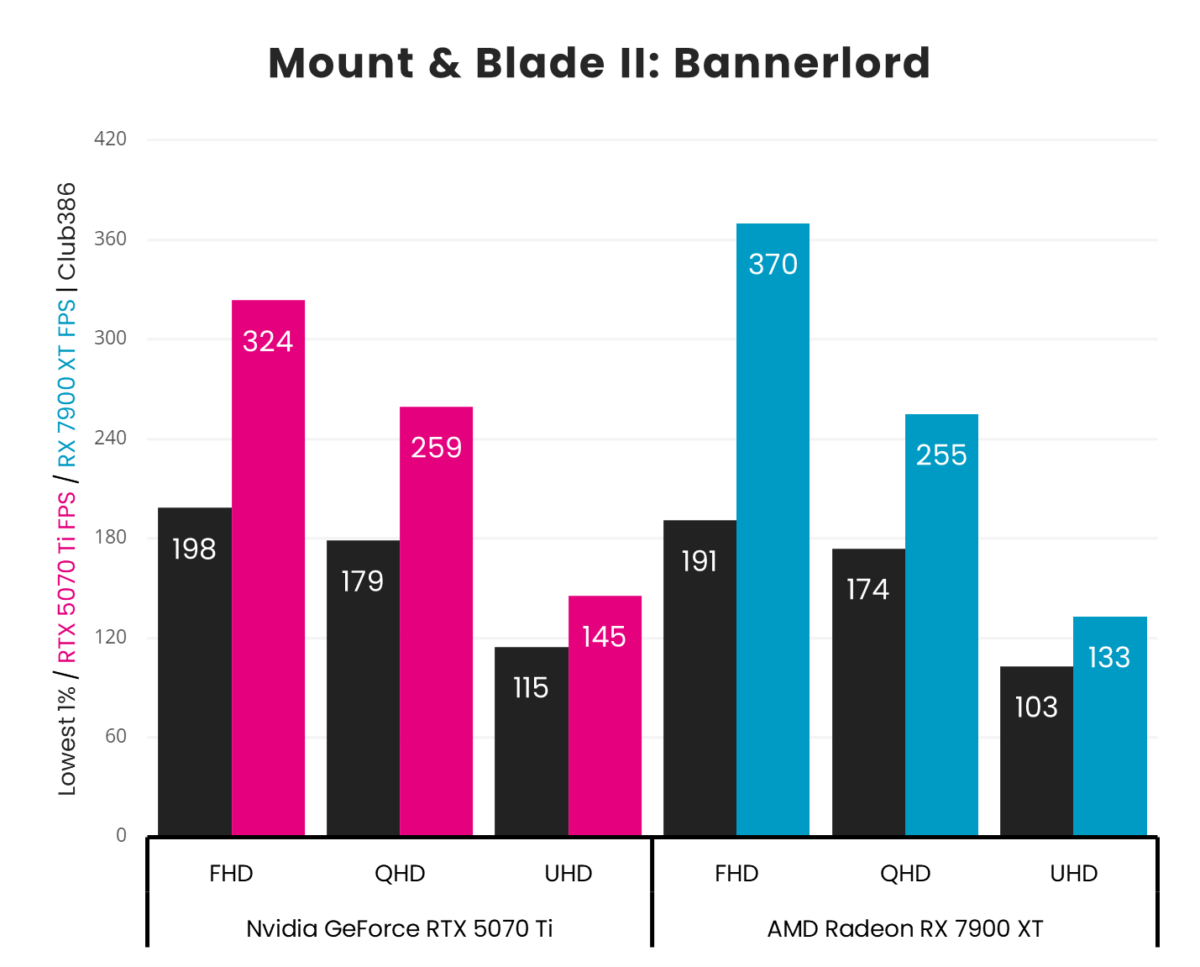
In a surprise twist of fate, Radeon RX 7900 XT actually beats GeForce RTX 5070 Ti in Mount & Blade II: Bannerlord while running the game at FHD. Its victory isn’t just by a few frames either, charging ahead by 46fps (14%) on average albeit with worse 1% lows than its rival. The two cards are neck-and-neck at QHD and remain close at UHD too, with respective gaps of 2% and 8%.
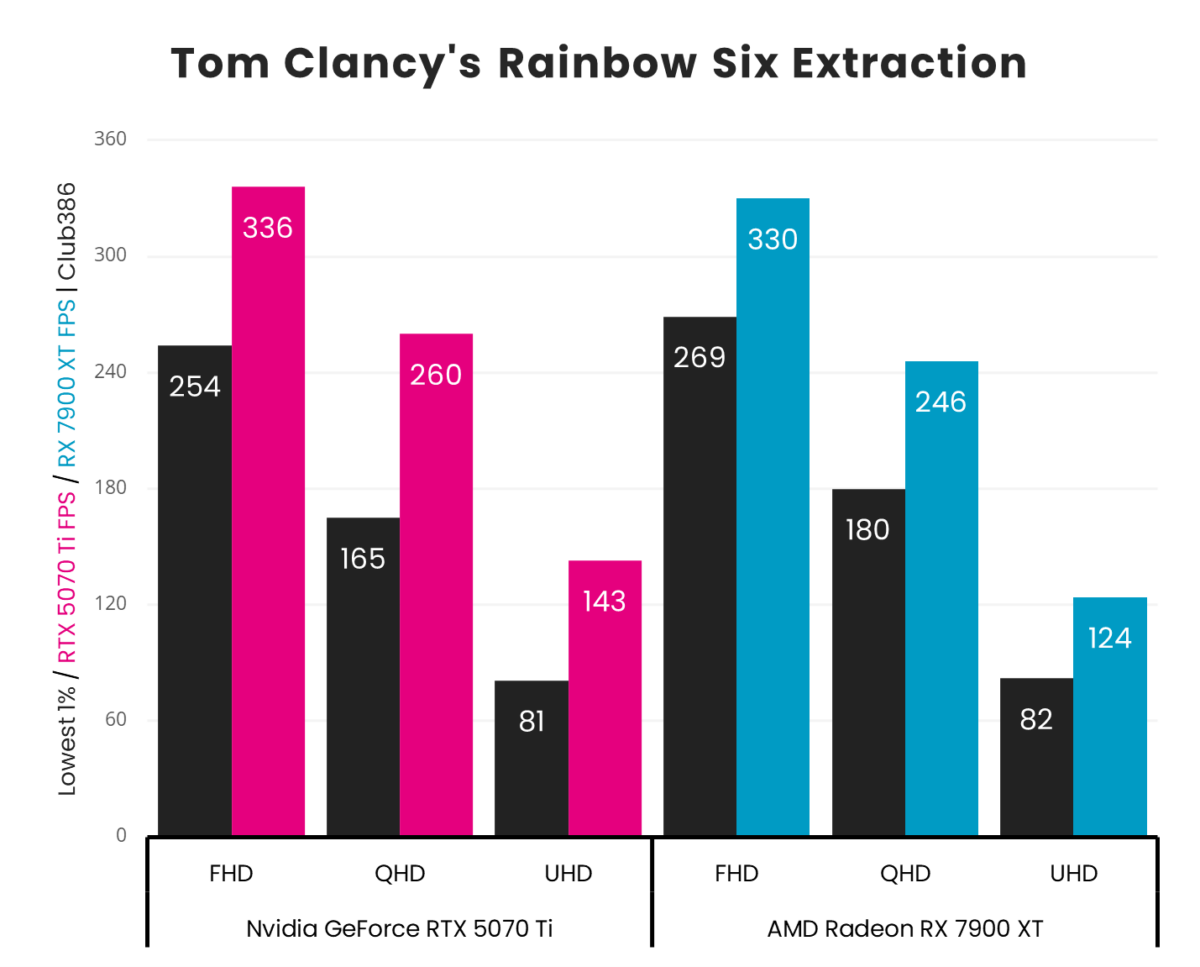
Rainbow Six Extraction crowns GeForce RTX 5070 Ti the victor in terms of average frame rates but it’s Radeon RX 7900 XT that takes the win in terms of 1% lows. These victories are much of a muchness, though, as both cards turn in suitably high performance in the first-person shooter, separated by 19fps at most.
DLSS vs. FSR
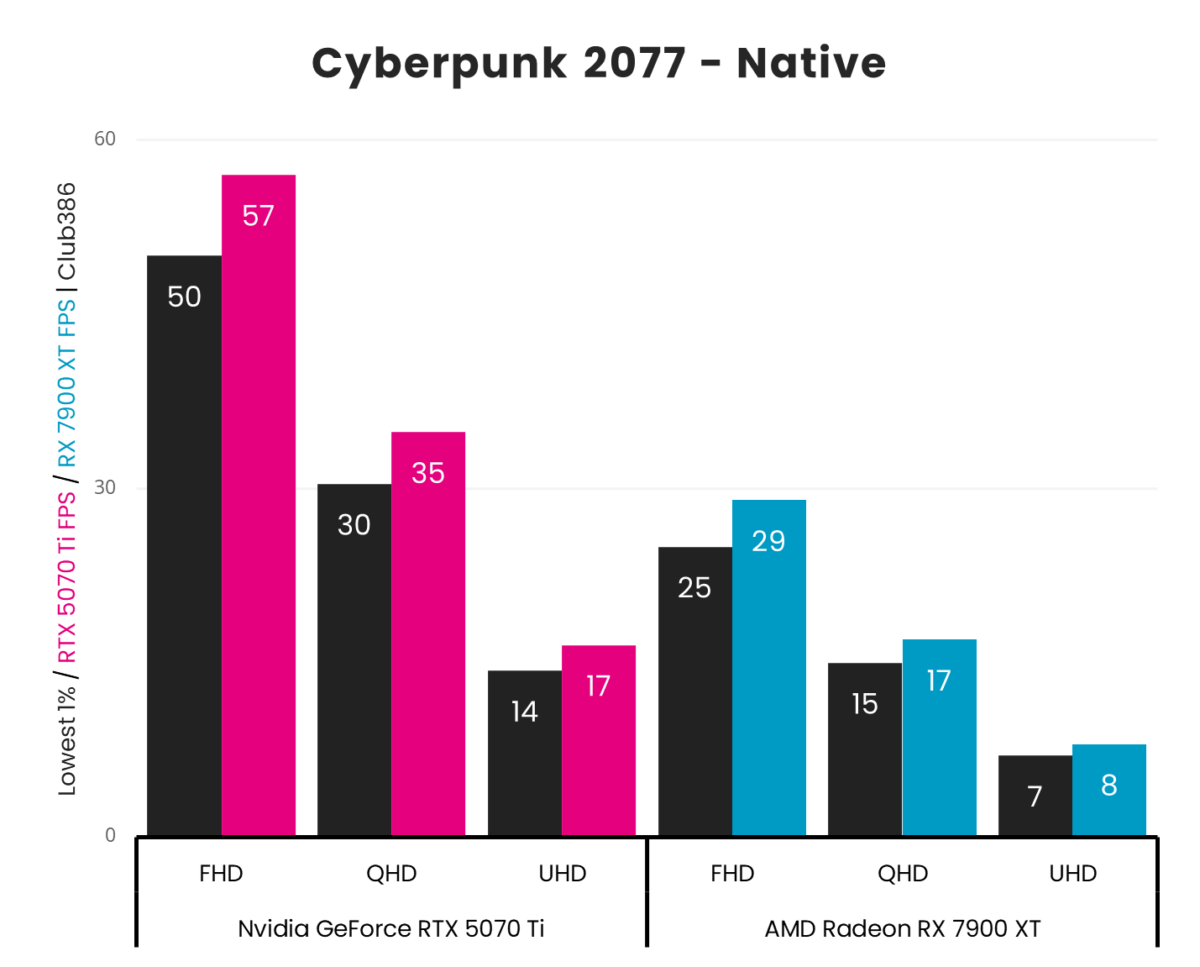
Path tracing is a beautiful form of rendering but it’s also one of the most difficult. GeForce RTX 5070 Ti just about manages to keep its head above water running Cyberpunk’s RT Overdrive preset but it can’t deliver a 60fps experience at any native resolution. Radeon RX 7900 XT fares much worse, however, not even managing 30fps at FHD.
Truthfully, though, I wouldn’t recommend anyone run such a demanding graphical preset without aid from resolution upscaling. Native performance still remains an important metric in this regard as there’s only so much that technology can do to improve performance.
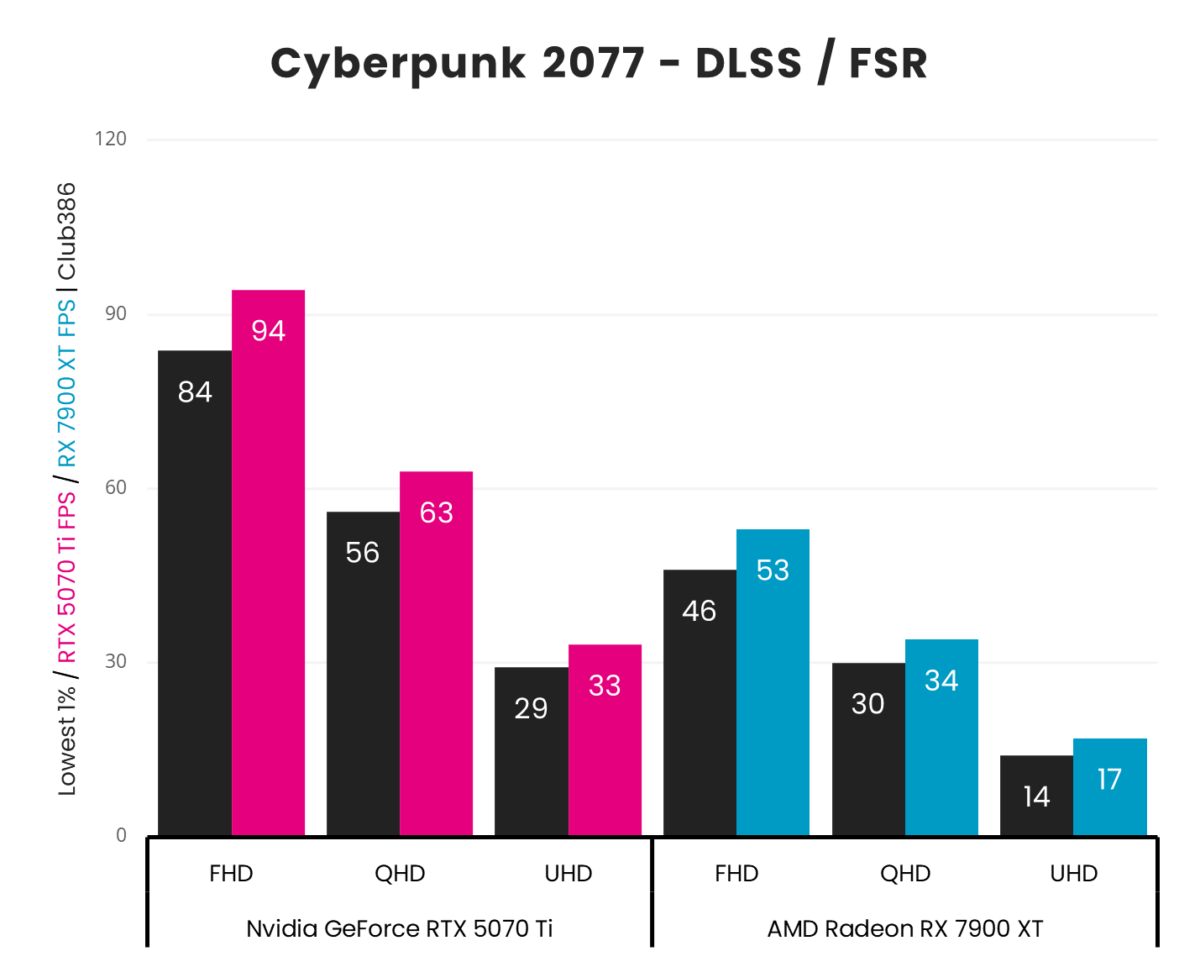
Engaging upscaling provides a welcome boost to performance on each graphics card, doubling average frame rates in some cases. The effects of DLSS give GeForce RTX 5070 Ti enough of a leg up it needs to pump out 93fps at FHD and 63fps at QHD. Less ideal but still notable, it also musters 33fps at UHD. FSR meanwhile isn’t enough to help Radeon RX 7900 XT hit 60fps, pushing north of 30fps at FHD and QHD but failing to manage the same feat at UHD.
GeForce RTX 5070 Ti sits smoother and prettier than Radeon RX 7900 XT, as the upscaling quality of DLSS remains superior to FSR, particularly using Nvidia’s new Transformer model. AMD is working to improve the fidelity of its solution via machine upscaling but it won’t benefit this particular pixel pusher due to technological limitations.
Keep in mind these results are using the highest quality preset available for both DLSS and FSR. Upscaling from a lower base resolution, in effect trading some fidelity for performance, should alleviate some of the pressures described above.
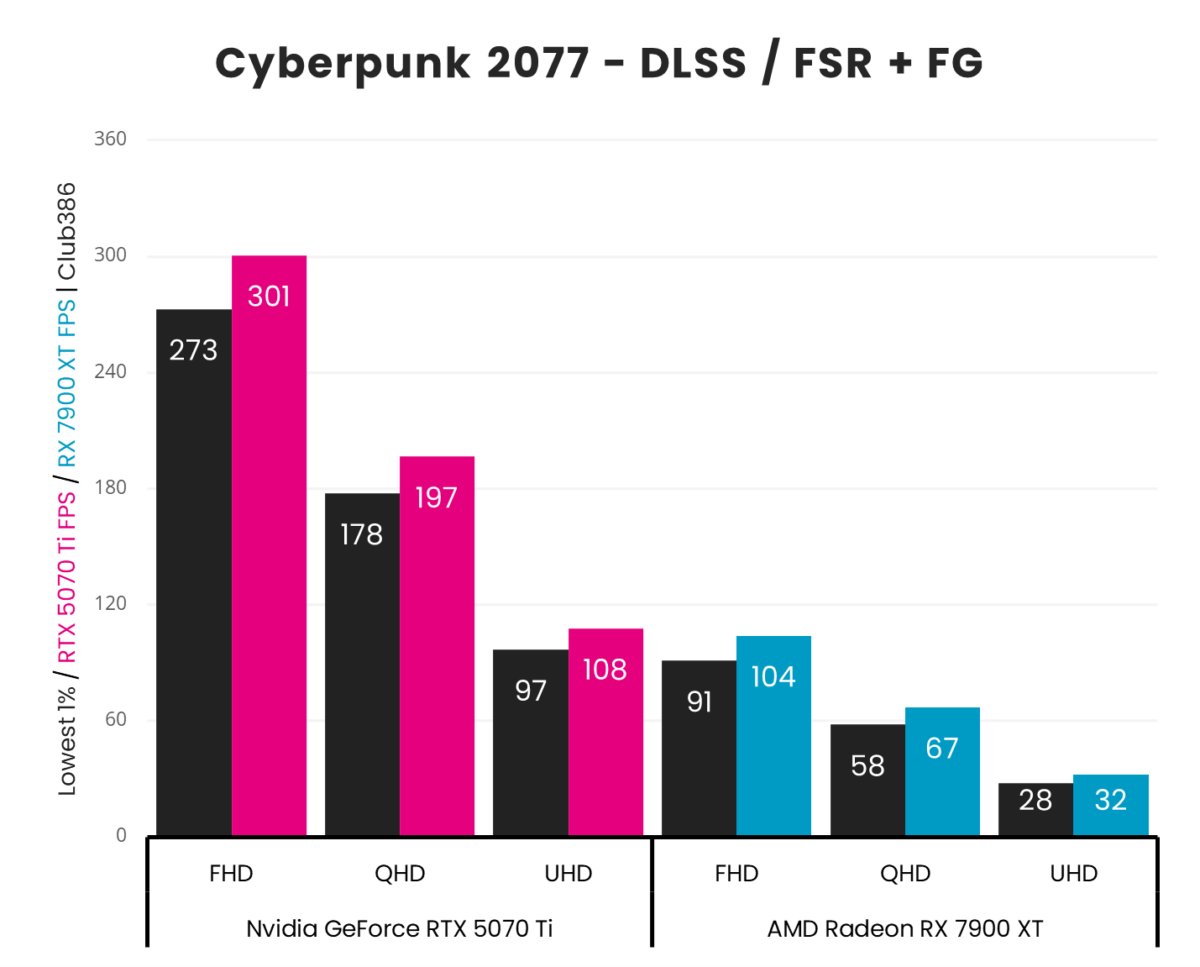
Any feigned hope Radeon RX 7900 XT had of competing with GeForce RTX 5070 Ti evaporates once frame generation enters the fold. Nvidia’s card goes from almost double to over triple the performance of its competition thanks to Multi Frame Generation, delivering just shy of 200fps at QHD and pipping over 300fps at FHD.
Any form of frame generation, single or multi, typically requires a base frame rate of 60fps to mitigate latency. With this in mind, Radeon RX 7900 XT sadly doesn’t make the cut at any resolution making the feature a largely fruitless point. GeForce RTX 5070 Ti experiences similar problems at UHD, outputting 108fps but boosting from 33fps doesn’t make for a suitably smooth-feeling experience.
Vitals
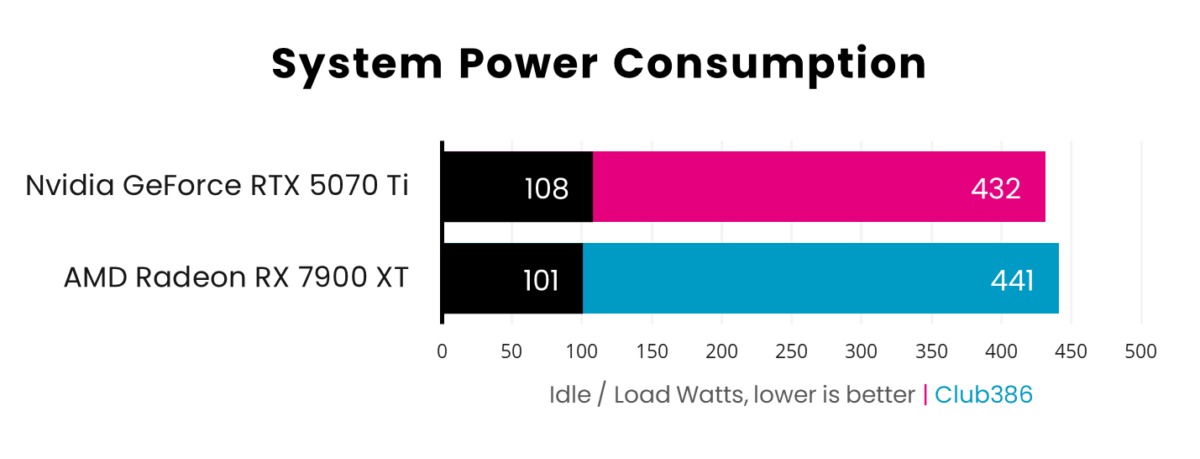
What’s a few watts between competitors? GeForce RTX 5070 Ti pulls more energy from the wall while idle but undercuts Radeon RX 7900 XT under load. Succinctly, Nvidia offers more performance per watt than AMD does.
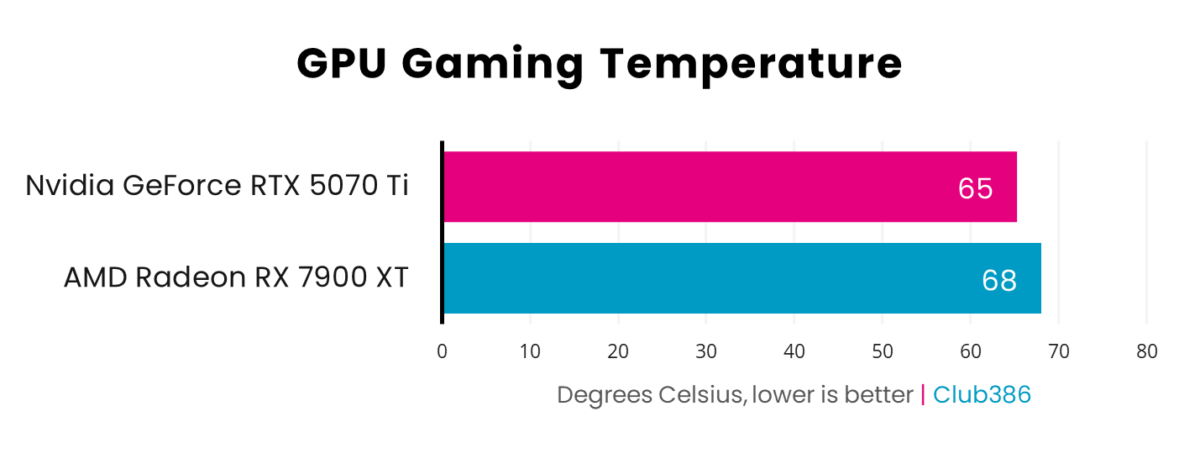
There are three degrees of separation between GeForce RTX 5070 Ti and Radeon RX 7900 XT, as the former comes out on top as the cooler card. Neither run particularly warm under load, demonstrating solid temperature management from both Nvidia and AMD.
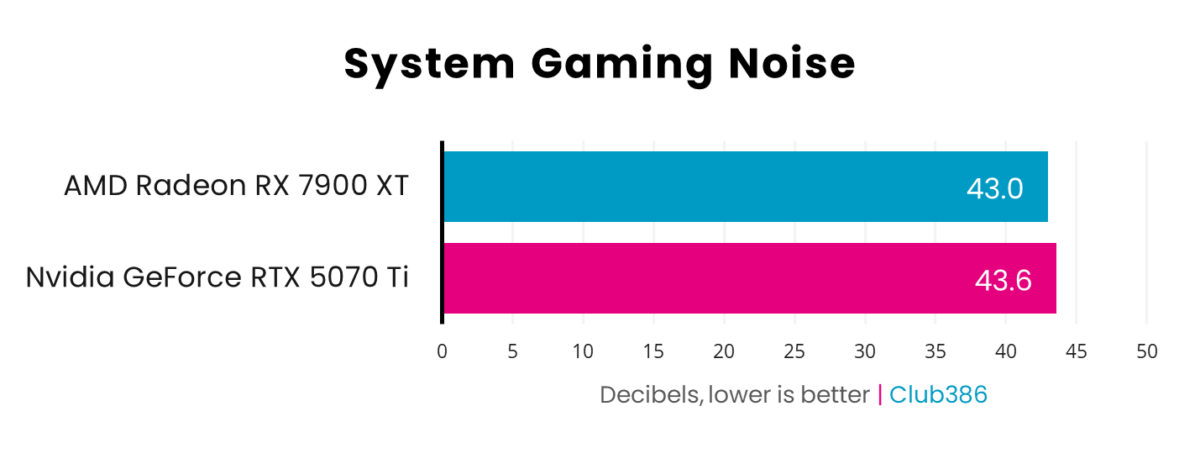
The noise profile of both GeForce RTX 5070 Ti and Radeon RX 7900 XT is practically identical. Running in the region of 43-44db, either pixel pusher should sit comfortably in a well-ventilated chassis without creating much of an audible fuss.
Conclusion
Pitting GeForce RTX 5070 Ti against Radeon RX 7900 XT proves a more interesting battle than I initially suspected it would be. Yes, Nvidia’s graphics card is superior in every way you could want it to be but the degrees to which it pulls ahead can wildly vary.
The decision between the two cards for creatives is simple: get GeForce RTX 5070 Ti. The only advantage Radeon RX 7900 XT offers is a larger memory buffer but this isn’t enough to wash away its relative large shortcomings in AI and 3D rendering. Even with a larger asking price, Nvidia’s pixel pusher provides much stronger value for these kinds of workloads.
GeForce RTX 5070 Ti emerges as the better pick for gaming too but not as decisively. It delivers substantially higher ray tracing performance and a more robust feature set but the card isn’t nearly as impressive in terms of rasterized rendering. If you’re someone that’s happy to live without these niceties then Radeon RX 7900 XT is worth a look. Of course, the smartest play of all is to wait and see how RX 9070 XT and its siblings turn out.
GeForce RTX 5070 Ti
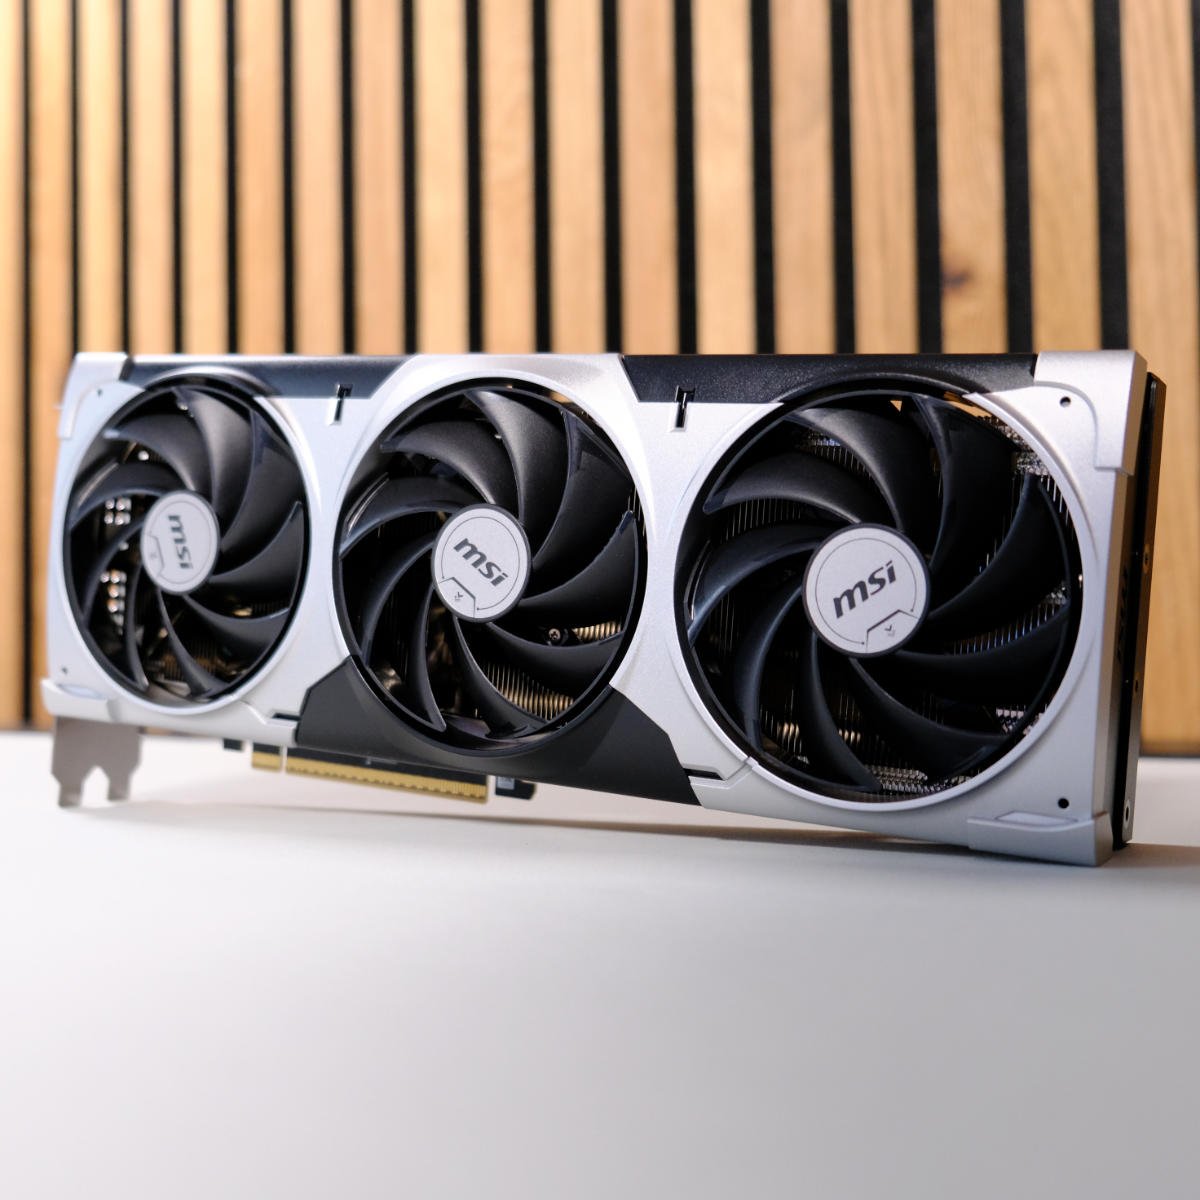
“Transforming Nvidia’s Blackwell GPU range into a trio, MSI GeForce RTX 5070 Ti Ventus 3X promises big things wrapped in its $749 MSRP.” Read our review.
Radeon RX 7900 XT
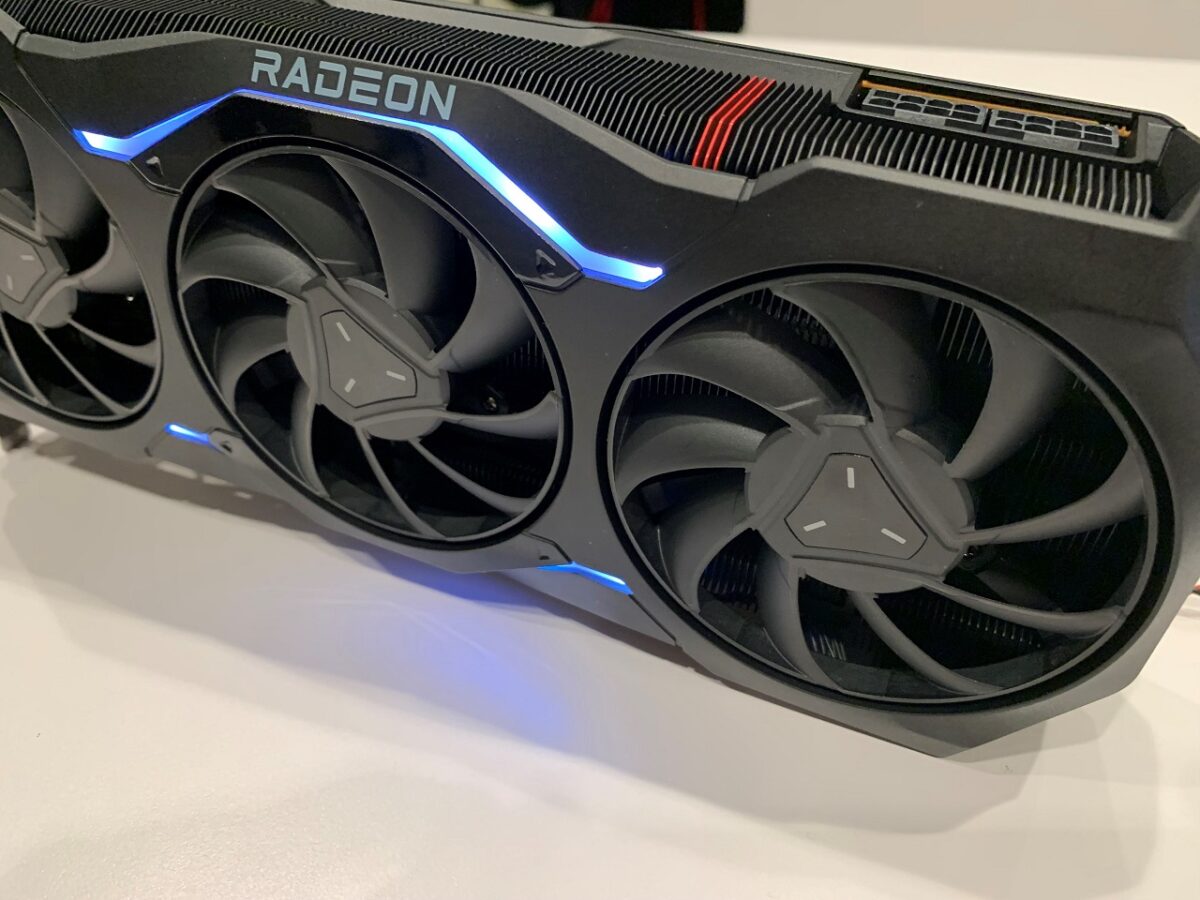
“Chiplets meet RDNA 3 in sensible fashion to create a great gaming card priced south of $900”. Read our review.